If you want to know how well your company is doing regarding generating revenue and profits, then you need to monitor financial KPIs. They are usually monitored by the CFO or financial department. By tracking, monitoring, and analyzing a company’s performance you can ensure you achieve your long-term goals and avoid bottlenecks. Keeping a healthy status is a consequence of knowing all about company expenses, sales, income, and cash flow regardless of the size and industry of the company.
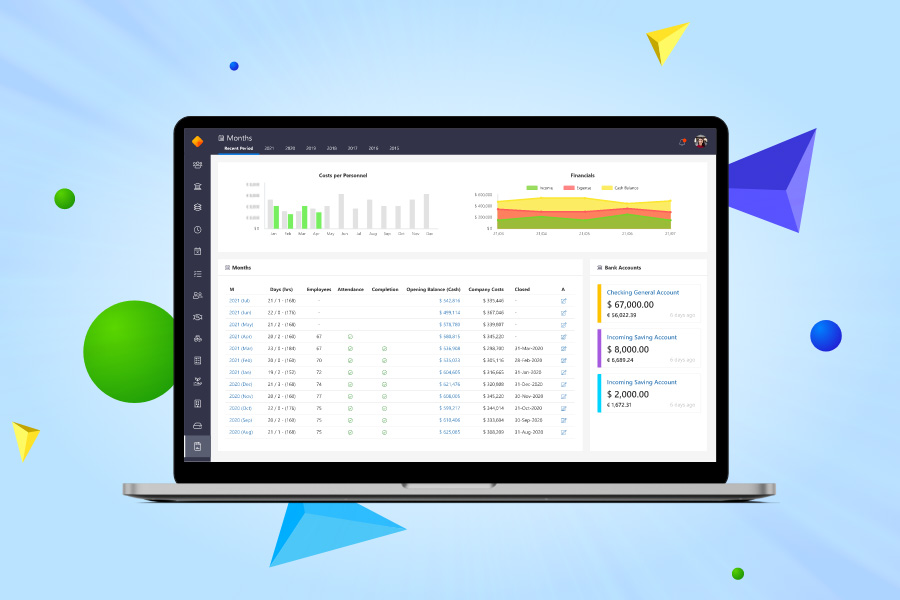
The easiest and most efficient way to display financial metrics is to set up a customizable dashboard within a smart system or tool, such as Vault. This will help your financial team deal with each metric and report and analyze processes with ease. Data is displayed through the power of business intelligence (BI) which will display financial reports in real time, show more information and make it easier to manage.
These key performance indicators are selected to reflect the needs of different businesses. Some of the listed KPIs are important for every segment or type of company, others are specific.
1. Net Profit Margin
This metric is one of the most closely watched financial KPIs. It shows the profitability of a business and its ability to grow in the long run. The net profit margin is typically expressed as a percentage and illustrates how much of each dollar earned translates into profit. It allows for the comparison of two or more businesses regardless of size because it's expressed as a percentage. This metric helps investors evaluate whether a company is generating enough profit from its sales.
- Net Income is sales minus general expenses, cost of goods sold, taxes and interest.
- Revenue is the total amount of sales generated by the sale of goods or services which the company is offering.

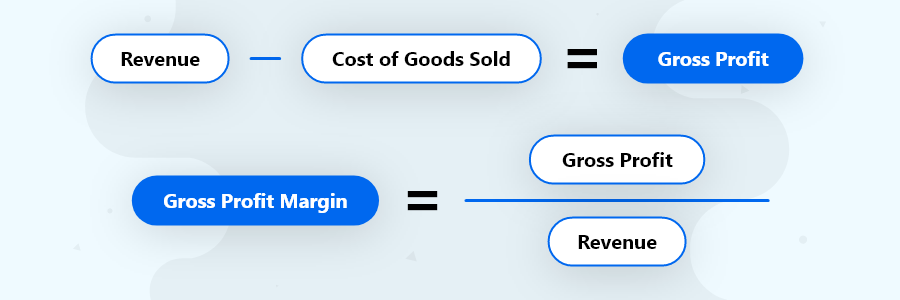
2. Gross Profit Margin
Gross profit margin is the percentage of revenue that exceeds the cost of goods sold (COGS). Gross profit represents your total revenue minus the cost of goods sold (COGS). The resulting figure covers the direct cost of production of the goods and may include materials and labor. Direct costs exclude expenses such as distribution, rent, administration, marketing cost and more.
Say your company earned $10,000 in revenue by selling services and your costs of labor are $4.000. This would mean your Gross profit is $6,000. To calculate the profit margin, divide gross profit by revenue which would mean your gross profit margin is 0.6 or 60%.
An NYU report on U.S. margins revealed the average net and gross margin across different industries. However, it doesn’t mean your ideal profit margin will match this number.
3. Operating Profit Margin
This financial KPI, also known as earnings before interest and tax (EBIT), shows how efficiently a company can generate profit through its main operations. This margin is calculated by dividing a company’s operating income by its revenue. The operating margin can be improved by increasing the efficiency of management processes by automating recurring tasks, efficiently using resources with precise time tracking which helps identify and reduce waste, through improving asset/inventory management, doing more effective marketing and by reducing the cost of goods or services.
If a company had revenue of $10,000, COGS of $4,000 and administrative expenses of $1,000, its operating earnings would be $10,000 - ($4,000+$1,000) = $5,000. Its operating margin would then be $5,000 ÷ $10,000 = 50%. If company is able to reduce the COGS and administrative expenses to $3,000 then its operating margin would be 70%.

4. Operating Cash Flow (OCF)
This KPI measures the amount of cash generated by a company’s business operations. It’s an important benchmark that’s used to determine the success of a company’s core business activities. OCF is an important financial metric which shows if the company can maintain a positive cash flow that’s needed for the growth of the business.

5. Profit and Loss Report
This financial statement reveals the company profits and losses on a monthly basis. P&L summarizes the revenues, costs, and expenses and provides you with insight into whether a company can generate profit by increasing revenue, reducing costs, or both. Your business is profitable if your income is higher than expenses and the cost of sales.
- Revenue, or income, is the amount of money received by the business.
- Expense is the cost accumulated for running the business.
- Net profit is the amount of money the business makes after deducting expenses and cost of sales from revenue.
6. Cash-Flow Statement
This financial statement provides all the data regarding cash inflows and outflows on a monthly basis. Net cash flow is the sum of cash made by the business through operations, investment, and financing.
7. Balance Sheet
This financial statement reports an overview of what a company owns, owes, and the amount invested by shareholders.

8. Current Ratio
The Current ratio expresses the businesses' ability to pay all their financial obligations in a short-term period, often within a year. This financial ratio concentrates on liquidity and the company’s ability to pay its debts from its current assets. A strong financial performance is indicated by a ratio between 1.5 to 3. However, it’s not unusual for companies to operate with a ratio less than 1 especially if the business is investing into growth or accumulating debt.
This metric is an indicator for financial analysts and investors about the efficiency of a company’s operating cycle. A high current ratio indicates that the company has a lot of cash or assets but lacks investment in innovations and business growth.
- Assets is an economic resource that has cash value.
- Account payables is a financial obligation that origins from previous transactions, such as a purchase order.

9. Quick Ratio/Acid Test
This metric measures the ability to quickly generate cash to meet an organization’s short term financial obligations. This ratio offers a more precise financial health overview as it excludes inventories from your assets as it’s assumed that you may not be able to quickly convert your inventory into cash. If the quick ratio is greater than 1, you’re likely to be able to pay off all your accounts payable.

10. Berry Ratio
This metric shows the company’s profit in a given period; it compares gross profit to its operating expenses. If the Berry Ratio is greater than 1, then it means the company is making a profit.

11. Burn Rate
The Burn Rate describes the rate at which a company is spending capital on a weekly, monthly, or yearly basis before generating its own income. This rate is used by startup companies and helps determine the amount of time a company has before it runs out of money.
For example, if a company has $12,000 in a bank and spends $,1000 a month, its burn rate would be $1,000 and its runway would be 12 months.
12. Return on Equity (ROE)
This metric shows the capacity of a business to operate with shareholder investments effectively in order to generate profits. ROE provides a measure of your profitability and efficiency. Increasing your ROE proves that you’re using your investments right in order to grow the business. A Damodaran NYU professor calculated the average ROE for a number of industries. For example, Information Services has an average ROE of 14.35% as of January 2021, which means that for every dollar in shareholder equity, the company generates 14.35 cents in net income.
- Shareholder Equity is the value of company assets minus its liabilities. This amount will be spread among shareholders if a company closes.

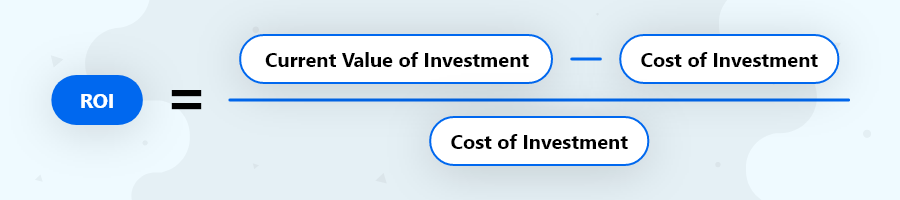
13. Return on Investment (ROI)
This metric is used to evaluate the efficiency of an investment. You can calculate the ROI simply by subtracting the initial cost of the investment from the current value of the investment and then dividing this by the initial cost of the investment and multiplying it by 100. A high ROI is positive for the business as it means they’ve been successful with the investment and used it to generate high returns.
14. Debt to Equity Ratio
This KPI is also named risk ratio and shows how much debt you use to fund your business. Joe Knight, author of the HBR TOOLS: Return on Investment, explains that this ratio tells you for every dollar you have of equity, how much debt you have and how extensively a company uses debt. If you want to learn more, read an interview about this metric here.

15. Working Capital
This KPI measures the financial health of an organization by analyzing readily available assets that can be used to meet short term obligations. It includes assets such as short-term investments, on-hand cash, short-term investments like commercial paper and accounts receivable. Working capital is the ability to generate cash quickly. A working capital ratio greater than 1 indicates that a company can cover its current liabilities.

16. Current Accounts Receivable
This financial KPI measures the amount of money owed to a company by its debtors. This metric will help business owners, financial analysts and accountants track the amount of income the company is waiting for and helps them calculate the average debtor days. It’ll also show how long it takes on average for debtors to pay their debt.
Success indicators of this metric are keeping a consistent amount of accounts receivable and accounts payable each month and keeping low debtor and creditor day averages. A high metric might indicate that a business is not able to deal with long-term debtors and therefore lose money.
17. Current Accounts Payable
This financial KPI measures the amount of money a company owes to its creditors, banks, or suppliers. This metric will help business owners, financial analysts and accountants track expenses that haven’t been paid yet and allows them to calculate the average creditor days. It’ll also show how long it takes on average for a business to pay its creditors.
Success indicators of this metric are keeping a consistent amount of accounts receivable and accounts payable each month and keeping low debtor and creditor day averages.
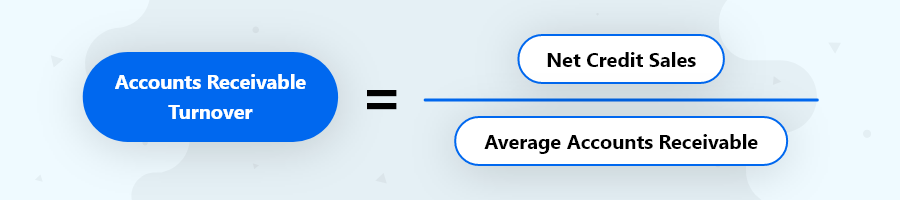
18. Accounts Receivable Turnover
This KPI measures the rate at which a company collects its accounts receivable, or the money owed by clients or customers. It shows how effectively the company manages the extended credit to customers and how quickly that short-term debt is paid. The higher this ratio is, the more effective the company is at collecting its payments.
19. Accounts Payable Turnover
This KPI measures the rate at which a company pays its creditors, suppliers, and banks. A lower accounts payable ratio might indicate that a company struggles to pay its debts.

20. Accounts Payable Process Cost
This KPI indicates the total cost of processing all payments and invoices in your company. According to the Accounts Payable Process Cost survey, there’s a large gap between top performers and those companies that are spending the most time processing accounts payable. It takes the bottom performers two and half times longer than the top performers to process one invoice. In terms of money, to process one invoice it costs the bottom performers $12.44 and the top performers $4.98. The cost is driven up by manual intervention, for example shipping or receiving documents or dealing with data errors.
This survey shows the need to invest in electronic invoice presentment, processing, and payment as they significantly lower the cost of processing invoices and paying suppliers.
21. Vendor Expenses
This KPI shows company payments due to vendors, which may indicate that the company is having trouble paying its suppliers on time.
A summary of Vendor expenses provides detailed information on who you’re spending your money with. This report includes the list of vendors and the total amount you’ve paid over a specific time period.
22. Budget Variance
This KPI shows if the actual costs differ from the projected budget. It shows if the budgeted amount meets revenue expectations. This KPI is mainly used in project management. A significant difference in budgets might be caused by wrong assumptions, faulty match, optimistic forecasting, or poor management decisions.
23. Line Item Budget
A Line Item Budget is the presentation of expenses which are grouped by category. This provides the financial department with an overview of where the money is being spent. It also helps managers estimate whether the budget for the current year is in line with the budget of the previous year. It also helps to cut the budget of departments or projects if it’s too high in comparison with other projects or departments or with the budget from the previous year.
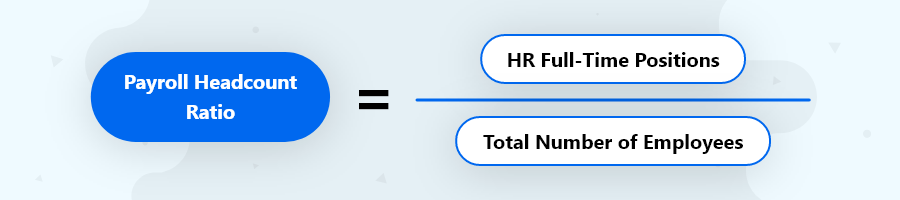
24. Payroll Headcount Ratio
This KPI indicates the total number of employees in your company that is supported per one dedicated full-time employee. Businesses need to determine the ratio of full-time HR positions to the total number of employees.
25. Sales Growth
This KPI measures the ability of your business to grow, to increase revenue over a certain period of time, usually over a month, quarter, or year. It shows the percentage for the current sales period compared to the previous one. This metric is an important indicator and is used by CEOs to make strategic decisions.
26. Days Sales Outstanding (DSO)
This metric shows the average number of days needed for clients to pay invoices. It’s starts from the day the invoice was issued until payment.

27. Payment Error Rate
This KPI shows the percentage of incoming or outgoing payments which were not completed because of a processing error. The failure can be caused by vague processes, lack of approval, using just email communication, weak documentation system and others. A high payment error rate indicates that the company needs to review the processing system of the accounts payable department.

28. Cost for Managing Processes
This KPI measures the cost needed for managing people and for planning. It’s mostly tracked by the business department. With information technologies you can lower the cost of managing processes, use resources more effectively and keep processes running smoothly with a low error rate.
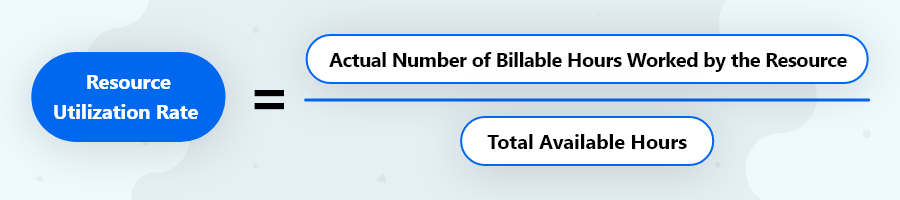
29. Resource Utilization Rate
This is one of the most important and cost saving KPI especially if your business offers IT, marketing, law, consulting, or other services. This KPI is mainly used by service-oriented businesses. It shows how wisely you’re using your resources as it shows how much of your team’s time is being spent on billable tasks. Putting people in the right place at the right time can increase productivity. On the other hand, if resource management goes wrong, it can cause project delays, a loss of customers, employee frustration and other difficulties which can affect the whole business.
30. Total Finance Cost
This KPI measures the total cost of the finance department compared to total revenue. It includes all the costs needed for day-to-day financial operations, personnel, systems and overhead. According to an APCQ benchmarking survey, top performers spend 0.6% or less of revenue to perform finance operations. As a CFO or financial analyst, you should be aware of how much your finance function is costing you.
Accounting KPIs
In an accounting department, KPIs can help track effectiveness within the department itself and assess the financial health of the entire organization or its departments.
In addition to all the KPIs explained earlier, accountants may use the following metrics to assess the company’s financial performance.
31. Line of Business (LOB) Revenue Versus Target
This metric compares the line of business (services or products offered by a company) revenue against its estimated revenue. The accountants can use this metric to assess specific departments or services. This KPI does not use a formula, but the actual revenue can be calculated and compered with the revenue target.
32. Days Payable Outstanding
Another KPI that measures the rate at which the company pays its payable accounts. It is observed over a specific period and measures the result in days. The fewer the days, the more quickly the company pays its creditors.
Days payable outstanding = (accounts payable x number of days) / cost of goods sold
33. Inventory Turnover
This is an efficiency KPI measuring the rate at which a company sells and replaces its inventory. It is typically measured over a specific period or yearly. A low rate indicates that the company purchases too much inventory or does not make enough sales. A high ratio can signal that the company does not have sufficient inventory to meet customers demands. There are two formulas to calculate this metric:
A. Inventory turnover = sales / inventory
B. Inventory turnover = cost of goods sold / (beginning inventory + ending inventory /2)
34. Time to close
Also called ‘days to close’, this metric shows how effectively the business meets its targeted closing date. It compares the target to the actual amount of days it took to close. During closing, the accounting team transfers the balance out of temporary accounts into permanent accounts and resets the temporary accounts’ balances to zero for the next accounting period.
Time to close = actual days to close / close window
KPI categories
Financial KPIs heavily rely on accounting data. Generally, all KPIs fall into the six categories listed above, depending on information they measure. There are a broad variety of KPIs that businesses use to measure their profit, revenue and expenses. Some KPIs can be more relevant to one industry than others. It would take much of your time to read about them all, so we’ve listed a few of the common financial metrics that fit each category, as well as their numbers in the above list.
Profit KPI examples
Net profit margin, gross profit margin, and operating profit margin.
Liquidity KPI examples
Operating cash flow, current ratio, and quick ratio, and working capital.
Financial KPIs
Current accounts receivable, current accounts payable, accounts payable process cost, vendor expenses, budget variance, line Item budget, sales growth, says sales outstanding, payment error rate, total finance cost, accounts payable turnover.
Efficiency KPIs
Inventory turnover (see accounting KPIs), accounts receivable turnover, accounts payable process cost.
Valuation KPIs
Earnings per share (is calculated as a company's profit divided by the outstanding shares of its common stock) and price to earnings ratio (measures company’s current share price relative to its earnings per share).
Leverage KPIs
Debt to equity, return on equity, return on investment.
Financial metrics for startups
As a startup, you might be looking for investors, or you might be in the process of planning for the future. For either scenario you will need to have some financial metrics at hand. Every investor (or bank) will want to know certain figures which will play a key role when considering their involvement in your business.
There are well over 30 KPIs to assess your startup business on financial health and prognosis, but the list below includes the most important ones.
1. Cash Runway
This metric shows how many months your startup has before it runs out of cash. The longer the runway, the better. Your cash runway compares your revenue and expenses. If your monthly expenses are greater than your monthly revenue, the runway will tell you when you are going to run out of cash. When you track your runway, you can make corrections before it’s too late. For example, you could reduce expenses, get more funding, or ideally increase your revenue.
2. Burn Rate
See entry number 11 to learn more about burn rate.
3. Revenue
See entry number 1 to learn more about revenue.
4. MRR (Monthly Recurring Revenue)
This is the amount of recurring revenue you generate from subscription customers or memberships. This metrics are predictable and give you more financial planning options.
5. Average Revenue Per Account
This metric tells you the average revenue per each paid account you have. It will indicate which parts of the business you should focus on to maximize your revenue. How many users the accounts have is not as relevant as the pricing.
6. MRR Churn
This is the monthly amount of revenue your lose from existing customers. This happens when customers cancel their purchase, subscription, or downgrade their plan. If your MRR rate keeps growing, it means that your customers retention is weak for variety of reasons. Get feedback from customers who cancel their purchase or account or downgrade their plan to get insight into what is going on, and work on a plan of action.
7. Customers Lifetime Value (CLV)
This metric tells you the average amount of revenue you can expect to collect from customers before they churn. CLV takes into consideration the monthly revenue and the average subscription/membership length of your customers. Having this metric will allow you to calculate how much you can spend to acquire new customers.
8. Customers Acquisition Cost (CAC)
This is the average amount of money your business spends to acquire one new customer. In simple terms, this is the marketing/sales cost. Spending too little might not bring in the customers your startup needs, hence you generate less revenue. However, spending too much can deplete your cash. Finding the right balance is the key.
9. CAC Payback
This is the number of months it takes you to regain your customer acquisition cost. The shorter the CAC payback period, the quicker you start making money from the newly acquired customer. A long CAC payback period combined with a high CAC and low LTV is dangerous for your business. It means you’re paying so much to acquire customers that you’ll never be able to recover the money you spent before they churn.
10. Gross Profit Margin
To read more scroll up to KPIs list
See entry number 2 to learn more about gross profit margin.
11. Return on Investment
See entry number 13 to learn more about ROI.
It’s time for a digital transformation of your business
Not too long ago the CFOs main responsibility was keeping the company legal and managing and running all finance activities. But nowadays CFOs are also responsible for helping achieve company growth. They are now strategically planning, precisely budgeting, wisely forecasting and successfully negotiating.
A decade ago, companies with $100 million in annual revenue spent about 1.5% of it on running a finance department. According to an APCQ benchmarking survey, the best companies spend 0.6% or less nowadays. Yet many organizations are still wasting millions of their revenue on inefficient day-to day financial operations. How do you fix this problem and shape your business? The answer is digital transformation. Start improving your business processes and increase productivity and efficiency.
Read on: Have you properly defined your KPIs to your best advantage?
This is where Vault can step in. Our highly experienced team can deliver solutions specifically tailored to your business needs. Contact us and we’ll tell you how Vault can help.
.png)