When you start running a project, you realize all the trade-offs you need to make and the adjustments you need to bring to your initial project plans. Your hands are full and you're having to juggle between the various project-related tasks, estimates, work assignments, rescheduling, and more.
But managing all these estimates, project deadlines, assignments, and more get a little confusing when the information is presented in a dry document format. It would help if you had good visualization tools and efficient visual methods to organize project data that will allow you to track the progress of each of your work tasks and make the right project decisions at the right time. A Gantt chart is a tool that lets you manage your projects with ease.
What is a Gantt chart?
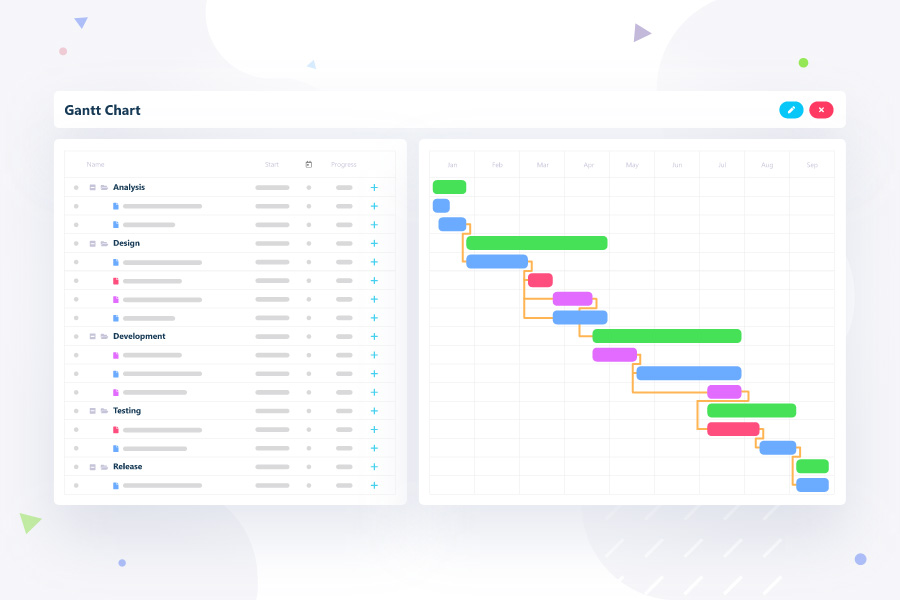
As the name implies, a Gantt chart is a charting method that presents project-related information in the form of a chart. The project details such as the overall project timeline, associated tasks, assignments, deadlines are shown against a timescale giving the user a quick overview of where the project currently stands and how close it is to the estimated deadlines and milestones.
Gantt charts visualize project information in the form of horizontal bar charts with the project start and end date serving as the timescale for each task. Some of the crucial project information that can be gathered with a quick glance at a Gantt chart include:
- Project phases
- Overall scope
- Timelines and deadlines
- Task dependencies
- Task assignments
Historical development
Gantt charts have a long history dating way back to even the earliest software development projects. It traces back its origin to a visual workflow chart called the harmonogram which was developed by a Polish engineer named Karol Adamiecki. Later in 1910, Henry Gantt refined this design to a more elaborative charting method called the Gantt chart.
Progress and linked Gantt charts
The basic component of a Gantt chart is its timeline. All tasks and work artifacts are presented in relation to a timeline aimed at giving the manager or supervisor a quick look at the project's progress. With a quick glance at a Gantt chart, anyone should see what’s lagging behind and all the tasks on schedule.
What are Gantt charts used for?
Gantt charts have a specific use in project management. They’re mainly used to give a visual overview of all the project specifics concerning the project timeline. Hence you need to figure out all the relevant details like the task breakdown of the project, the various tasks, their estimated time duration, work hours, estimated effort, the staff assigned to each task, and any possible problems or uncertainties that you expect the project to experience.
You should also be prepared with the estimates for the crucial deliverables and the dependencies between each task. For instance, if task A’s output is necessary for task B to commence, any delay in task A could cause a delay to task B. Gantt charts can help you understand such task relations and help you assign the right resources for tasks and schedule your projects for maximum productivity and efficiency.
A Gantt chart can be compared with the actual project progress and revised to create new estimates based on the current situation. By adding new estimates, you also can see how much your project has deviated from the original plan and can easily assign the proper priorities to the tasks for optimal project conditions.
So, to summarize the uses of a Gantt chart:
- Better resource management: Resource allocation and sharing information regarding resource allocation to all stakeholders.
- Project tracking: Make changes to project schedules and assignments and compare them to the original plan.
- Better team collaboration: Communicate the project plan and details to relevant stakeholders with ease.
- Task management: Identify any issues within the project plan and make the necessary adjustments.
Read on: How Gantt charts help in different areas of project management
What should every good Gantt chart have?
Some of the basic information every Gantt chart should have is:
- Work breakdown structure
- Progress indicator
- Dependencies
- Milestones
- Assignments
- Completion rate
- Deadlines
- Due on
- Risks
- Resources
- Assets
- Links
The Gantt chart should be updated daily so that the project progress is well tracked and all the new changes in requirements, assignments, and scheduling are accounted for.
Benefits of a Gantt chart
A Gantt chart is an invaluable, straightforward tool that helps break down complex information and makes it easier for everyone to understand. Project dependencies, deadlines, and resource allocations can be easily understood, which allows team members to understand their roles and task expectations. Here are some more benefits of using Gantt charts:
- It helps enhance productivity by reducing the time it takes to communicate project plans with the entire team and the stakeholders. It improves project transparency and accountability, thus enabling the team to focus on time-bound tasks efficiently.
- Using Gantt charts helps managers plan their resources with ease. They can quickly identify project dependencies and allocate the resources to make the best use of their time. As it's a simple visual tool, even novice managers can easily take up project planning and make the right decisions confidently.
- A Gantt chart helps with accurate information sharing and tones down the complexity of the project requirements. It essentially gives a calendar view and lets people focus on their responsibilities.
- The Gantt chart information is presented in a single page and can be used in stakeholder meetings to give a quick overview of the project progress.
- It helps establish and keep track of the complex task dependencies in a project and make the right plans for smooth project execution.
- You can easily spot overused and underused resources. This allows you to share the workload uniformly among your team members.
A Gantt chart is a great tool for managing remote teams as it eases communication and information sharing among team members. It ensures transparency among the team members no matter where they’re allocated.
Read on: Top online Gantt chart software in 2021
Create your own Gantt chart now
Gantt charts are a handy tool that make project management and planning simpler and more efficient. Hence why we made sure to include it as part of Vault’s project management tool. With just a few clicks you can create a complete Gantt chart for your project.
You can easily enter the details of each task, deadline, cost, and time estimate and get a neatly laid out Gantt chart generated for your entire project plan. Our intuitive Gantt charts can be updated in real-time and can be easily shared across the collaborative online platform so that information is shared across your teams quickly and the job gets done on time.
Reach out to us for a consultative call to explore how we can help you.
.png)