
Working may have moved to a remote model, but the productivity needs have not gone down. Managers need the best tools so that they can keep track of their project progress. One of the simplest yet powerful features of digital tools that make it easy to track and manage project-related tasks is the Gantt chart. It gives you a quick view into the various tasks, timelines, assignments, and interdependencies and helps you adjust them for optimized results.
Read on: Remote company 101: the starter pack.
What is a Gantt chart?
A Gantt chart is a visual representation of a project’s timelines, tasks, events, and assignments. It’s a horizontal bar chart where all project activities are planned on a project timeline. Each activity is indicated with a bar that shows its start and end date.
The overlap or interdependency between any tasks can be made applicable. For instance, task B may not be able to commence unless task A is completed, and task C might be waiting for an input resulting from task A. This makes both task B and task C dependent on task A and cannot be carried out simultaneously when task A is yet to be done.
What’s special about Gantt charts?
A Gantt chart is essentially a project calendar that needs to be updated every day so that you get accurate updates on the project progress and end date estimates.
Gantt charts aren’t a modern invention, they’ve been around since the mid-1890s. The reason why the Gantt chart has survived so many decades well into modern project management is because it’s such a useful tool. It provides several crucial pieces of information related to the project which you can view with a single glance, saves a lot of time and can help simplify project planning.
There are several advanced software tools that make updating Gantt charts a breeze and allow for even more optimized usage. You can have a comprehensive view of the project schedule, use drag and drop and zoom options to navigate and manipulate the schedule with ease. Click here to read our previous blog where we cover Gantt charts in more detail.
Why are Gantt charts important?
Creating a Gantt chart provides a visual overview of the entire project from start to finish, the team members involved in each step, and all the tasks required to complete the project. Everyone who can see the Gantt chart is on the same page and gets clear information about tasks, dates and milestones. You can manage the workload by delegating tasks evenly across the team. The assignees update regularly how far they are at completing the tasks, so it is easy to track the overall project progress. With Gantt charts you get a grip on the project and don’t need to remember what needs doing next, by whom and by when. The team members see how future tasks depend on them which keeps them motivated. Gantt charts can also be used as a budgeting tool. The cost of resources can be reduced if you involve less people in the project by allocating tasks efficiently and by identifying which tasks have the highest financial impact on the project.
What makes a good Gantt chart?
All good Gantt charts include the following key elements:
- List of tasks – These are all the activities required for completing a project.
- Start and end date of each task
- Dependencies – Links between project tasks visualized by lines and arrows to point out their relationship.
- Start and end date for the entire project
- Milestones – Checkpoints which identify when an activity or a group of activities has been completed, or when a new phase or activity is launched. Project milestones help you keep track of the schedule, deadlines and reach critical KPIs.
- Reporting and exporting – Allows you to create reports consistent in design and export them in PDF or JPEG format.
- Project progress - You can use specific colors on task durations or view completion percentage displayed. The progress view indicates whether a task is on track, at risk or delayed.
- Critical path – Marks the longest sequence of dependent activities in a project and measures them from the start to the finish.
Are Gantt charts still used?
Definitely, they are widely used in project management and other business projects. It would be quite a challenge to prepare a visual project status report for customer meetings without the good old Gantt chart. The data in Gantt chart builds the base for all project communications with the team and stakeholders. They allow teams to collaborate seamlessly and efficiently.
Top Gantt chart software tools
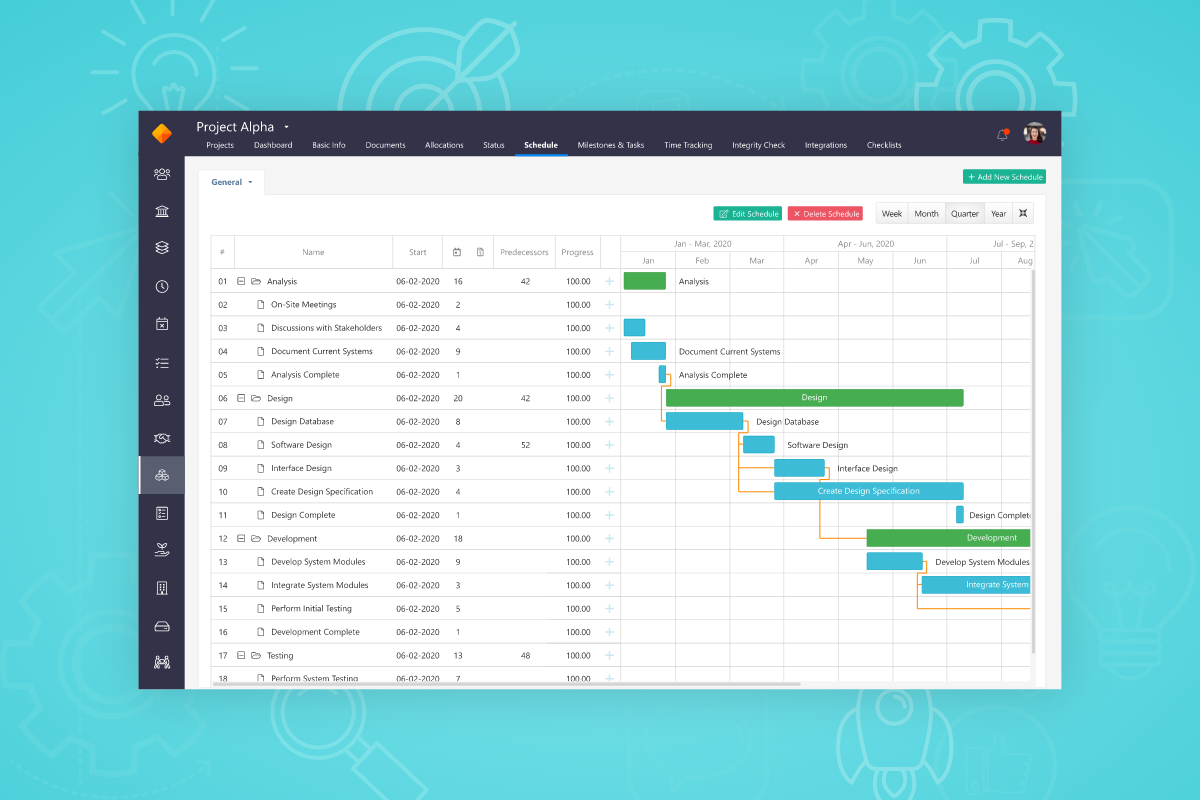
Vault provides an entire suite of project management and time tracking tools along with a Gantt chart that integrates well with other operations like scheduling, time tracking, project transactions, checklists, KPIs, and more.
Your project dashboard will automatically get updated as you make changes to your project schedule and share it across your team with ease.
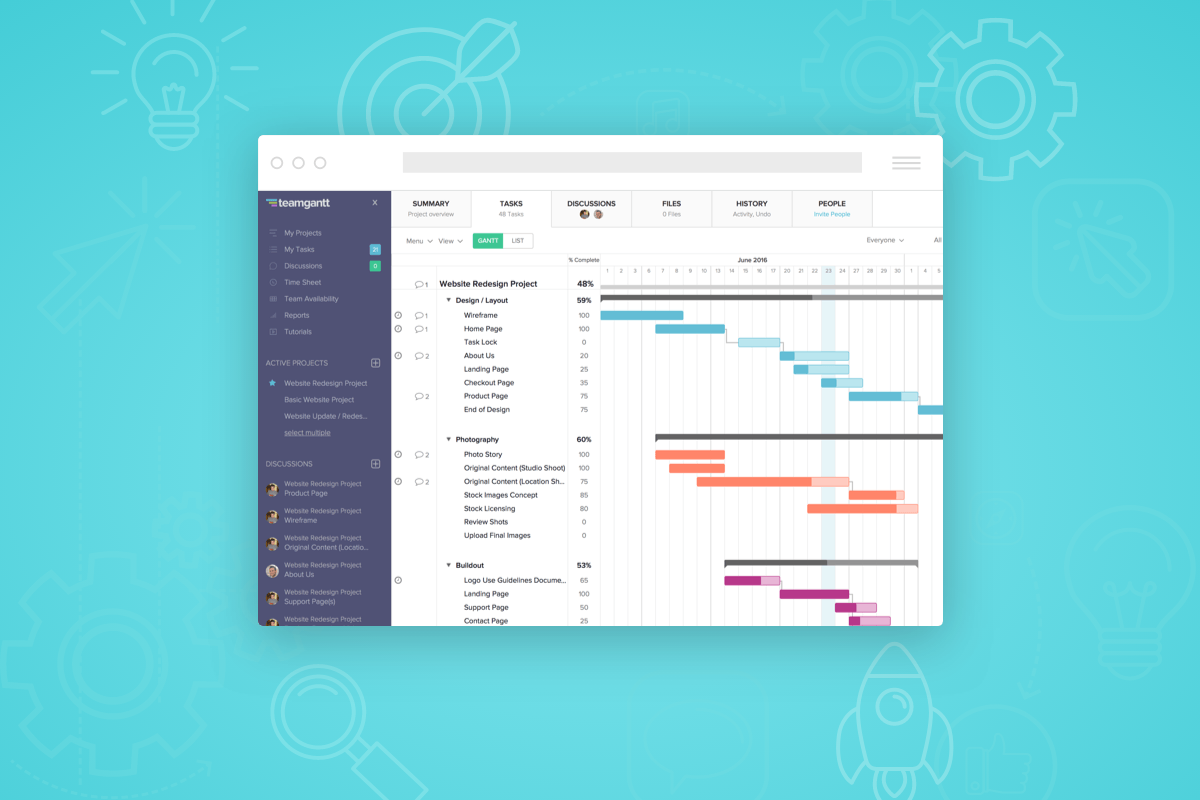
TeamGantt is an easy-to-use Gantt chart app with basic features like baselines, drag and drop, multiple project views, and guest permission. They also provide tutorial content to help you get started with Gantt charts. This tool has a good set of basic features but lacks advanced features to carry out complex project management tasks.
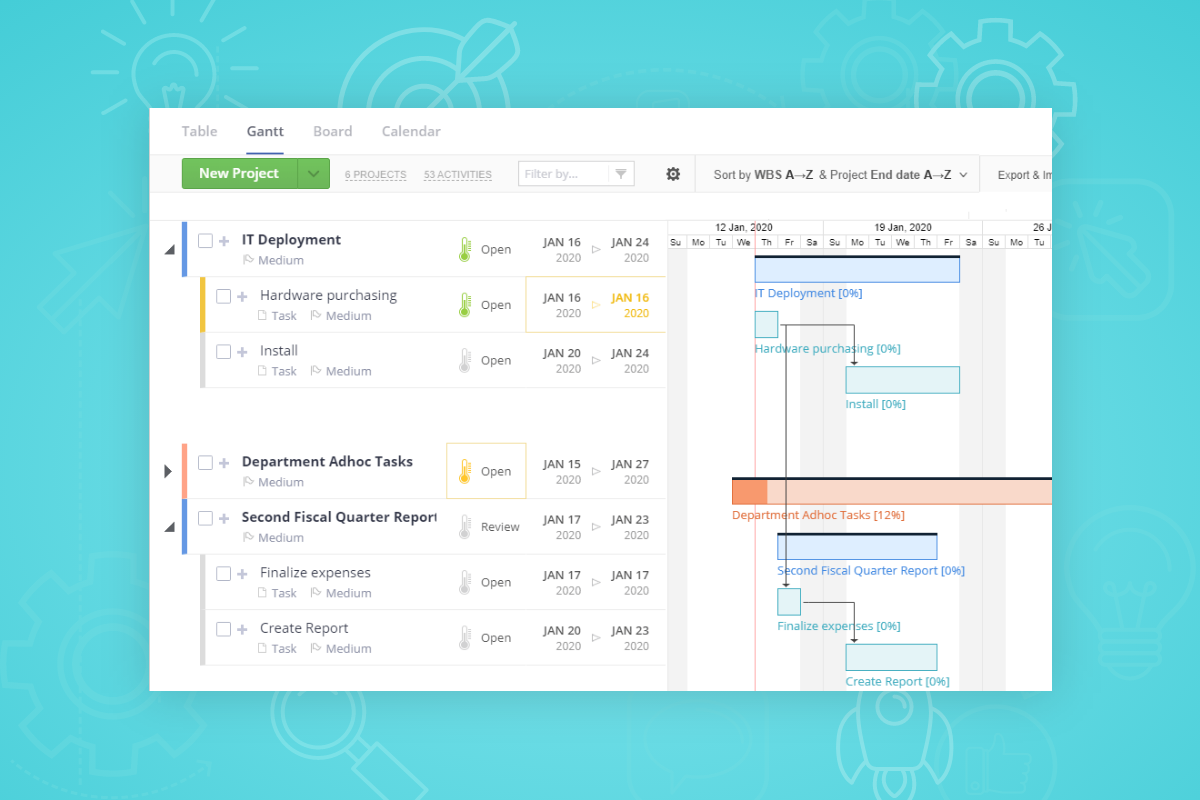
Easy Projects is a well-rounded project management solution with a Gantt chart feature. It also has good billing options, budgeting, and task designation features that work alongside the Gantt chart feature.
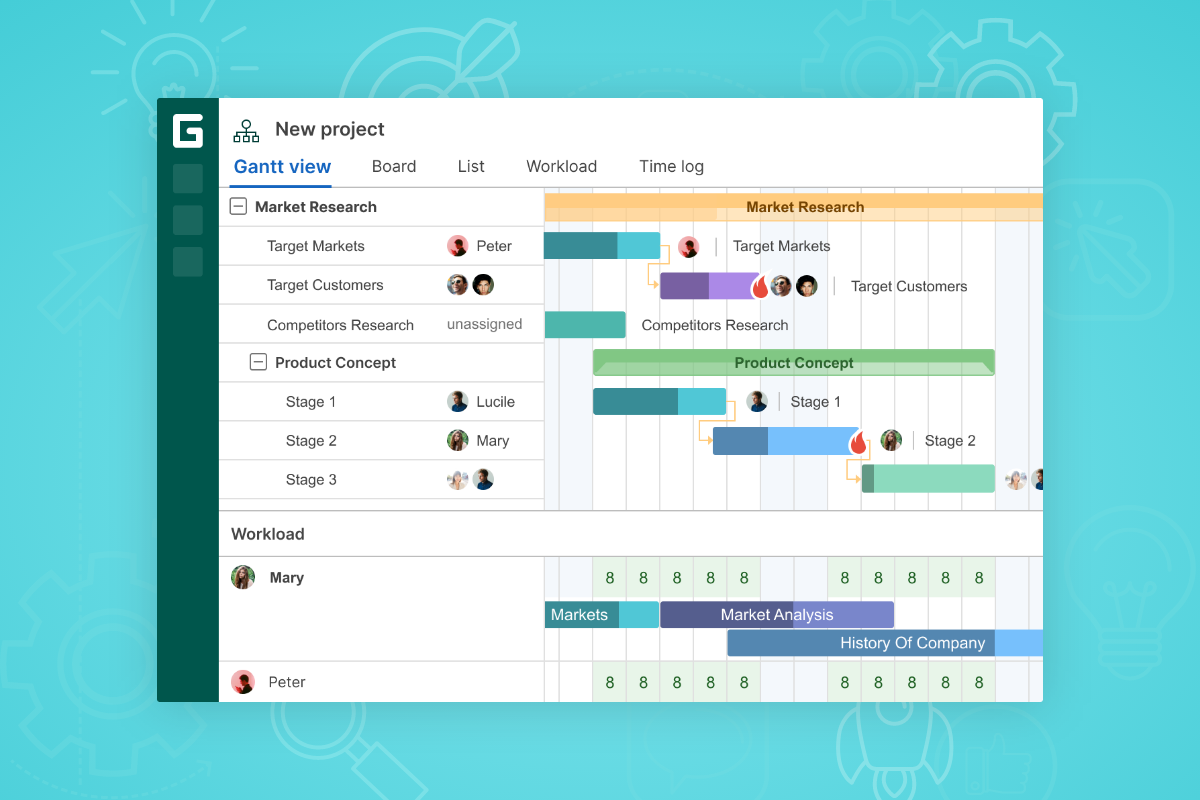
GanttPro is an easy-to-use Gantt chart application with some exciting features like support for multiple workspaces and projects, drag and drop, and options to set different levels of access permissions. But this is a fairly simple tool at an affordable rate with not much support for mobile options and integrations.
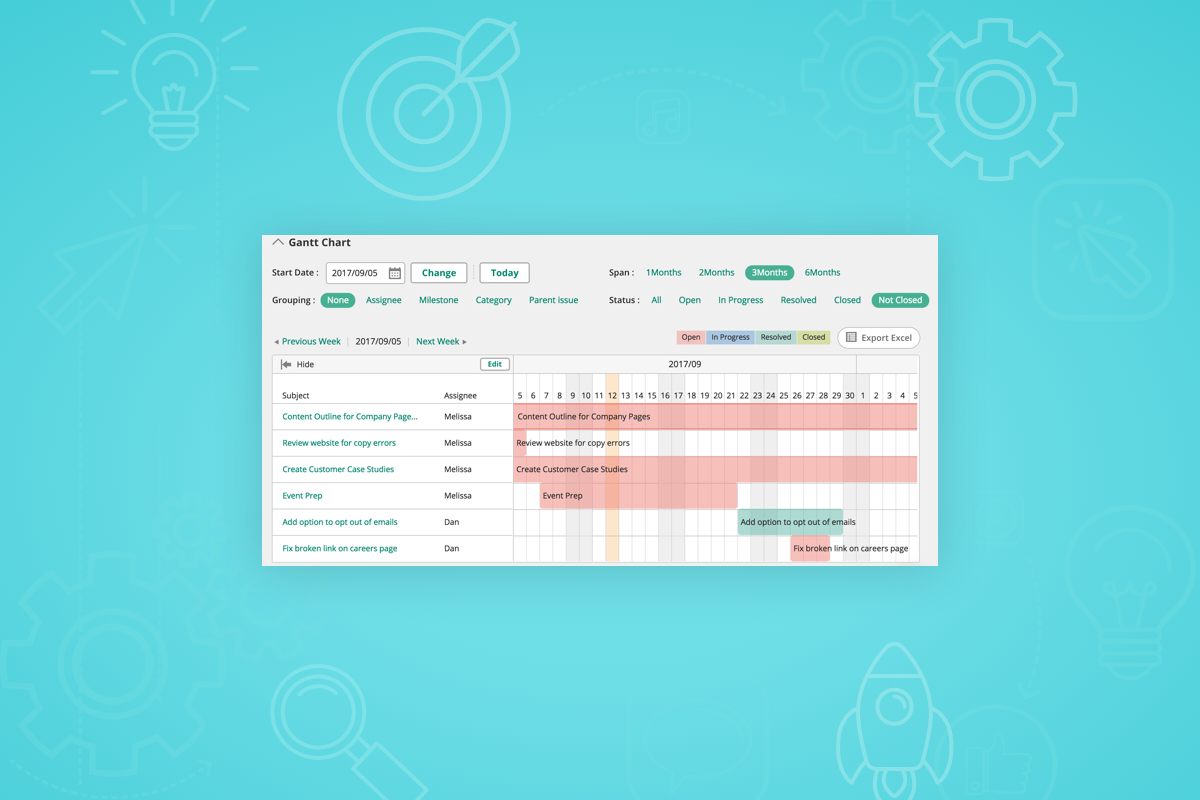
Backlog provides a Gantt chart solution so that you can get a quick view of your project-related tasks. It’s easy to edit and gives a good uncluttered visual representation of your project status. It allows for drag and drop, tracking teammate’s schedules, and more.
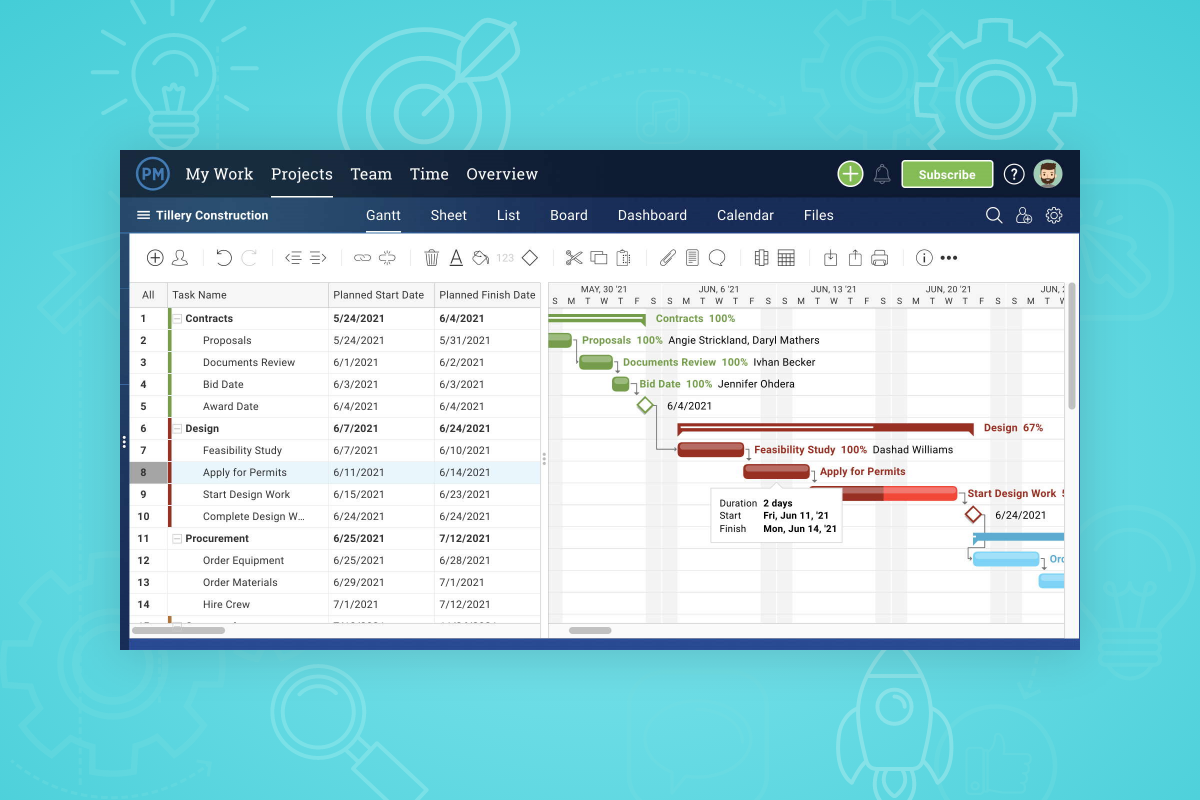
Projectmanager.com is a project management software solution with a wide range of features, including budgeting, time tracking, task management, document management, and reporting. Gantt charts are one of its major features and integrates with other applications like MS Excel, Word, Project Server, and Google Docs. You can also import settings from MS Project plans and customize the security settings.
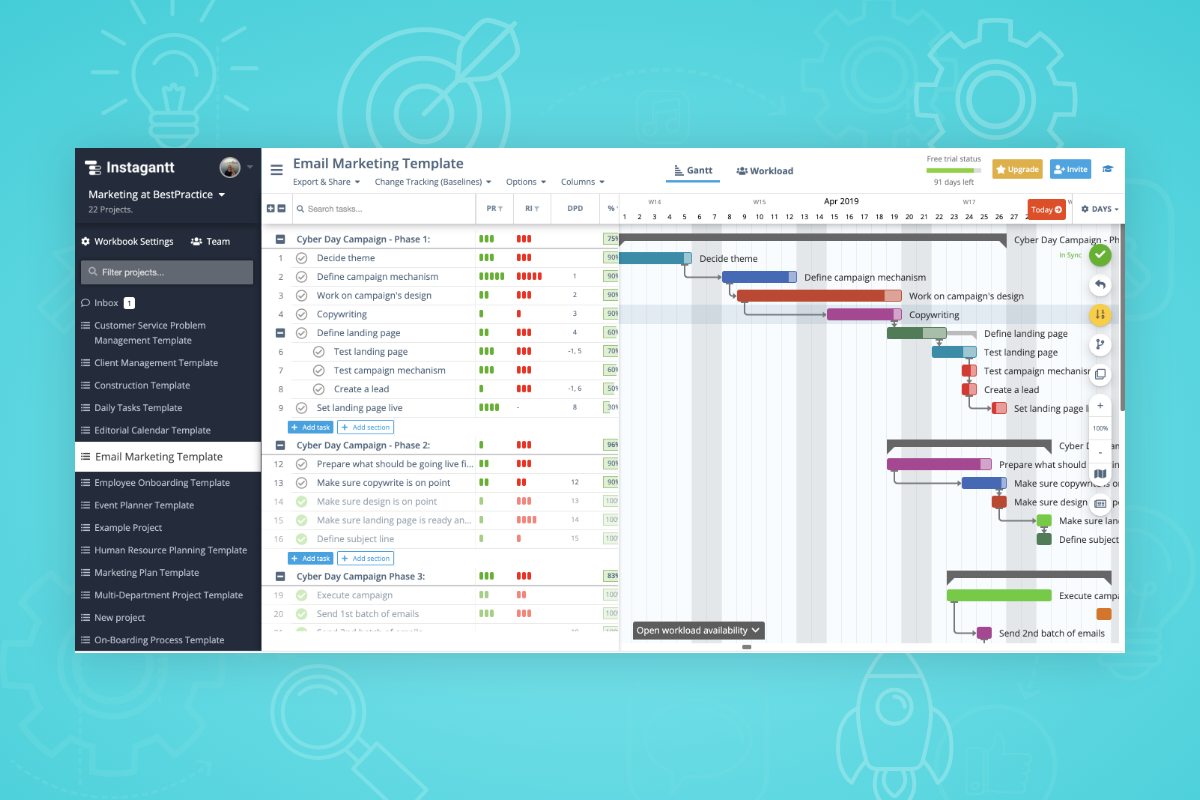
Instagantt is one of the most popular Gantt chart software in the market with all the basic features and support for exporting to other formats like excel, image, and pdf. It also allows for public snapshot sharing, team collaboration, adding custom views and fields, email notifications on project assignments, and more. It allows for advanced collaboration and project scheduling.
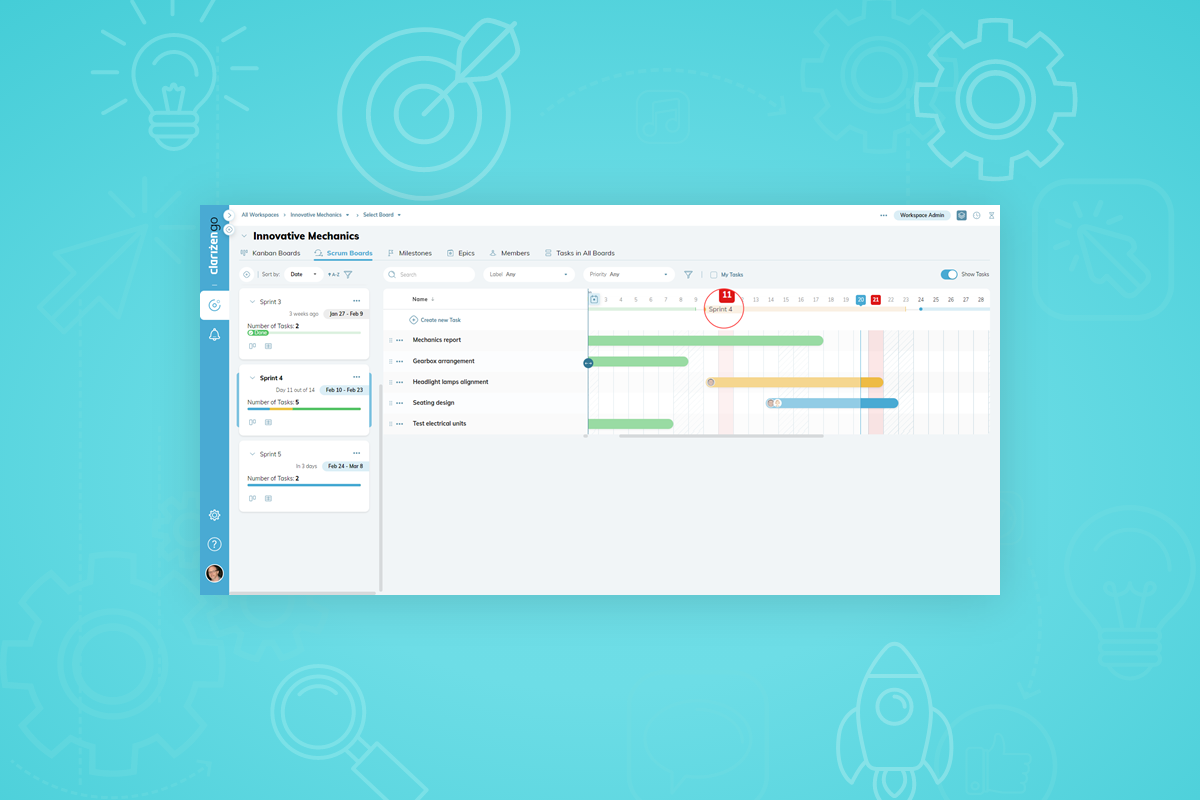
The Clarizen project management solution provides an interactive Gantt chart that covers all the key features. It can be found under the Utilities action bar of the Project module from Clarizen. The Gantt chart from Clarizen can be easily shared and printed for use in project meetings and communication.
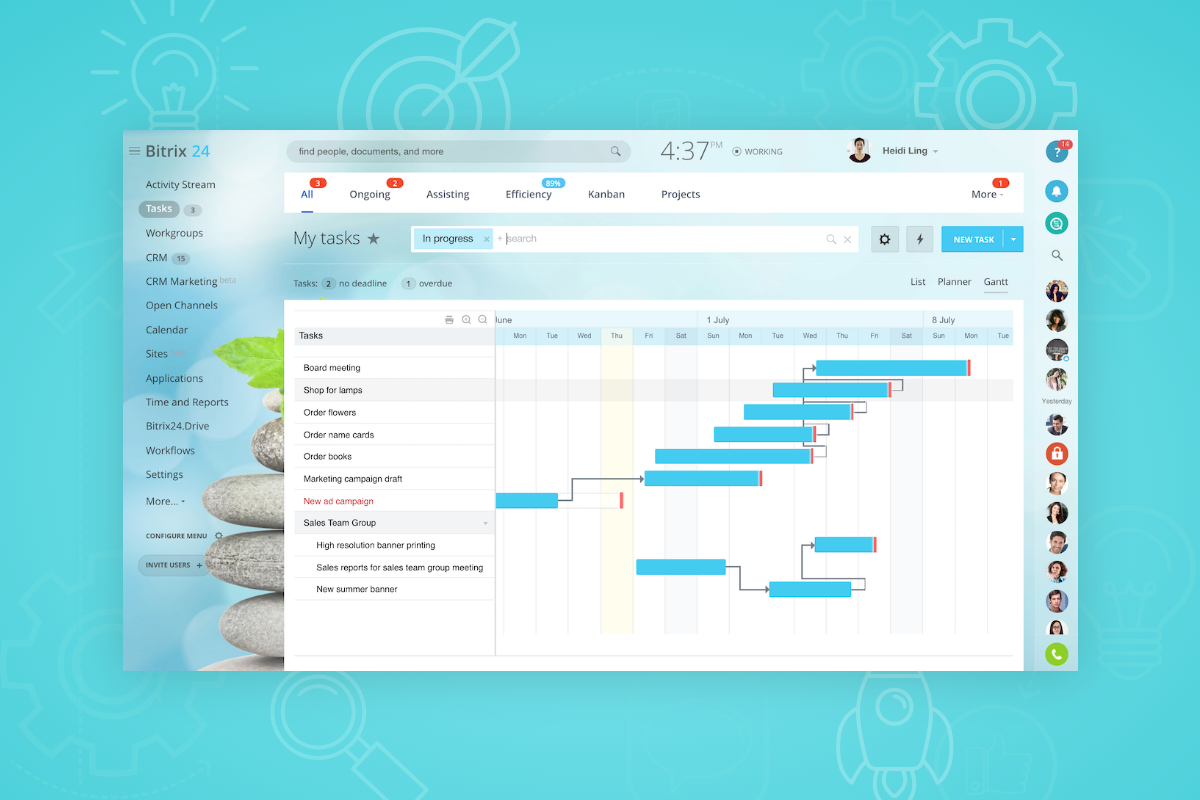
Bitrix24 is another complete project management and communication platform that provides Gantt charts as part of its features. Bitrix24 makes it easy to define dependencies in the Gantt chart and has an intuitive interface. But it’s an expensive tool and doesn’t currently provide any free plans.
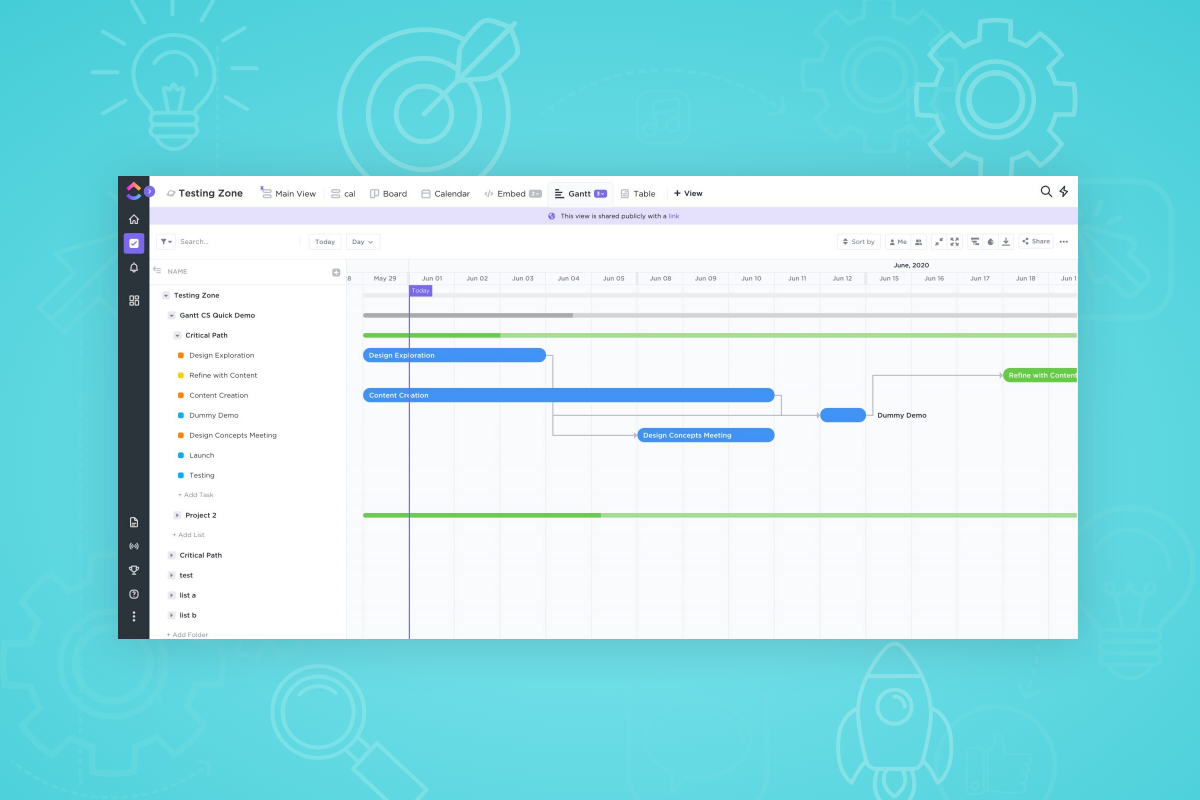
ClickUp is essentially a time tracker application that has a native Gantt chart feature. It presents an easy-to-use Gantt chart maker that’ll come in handy for quick project management tasks. Click Up can be integrated with any Google App and thus aids in better collaboration as well.
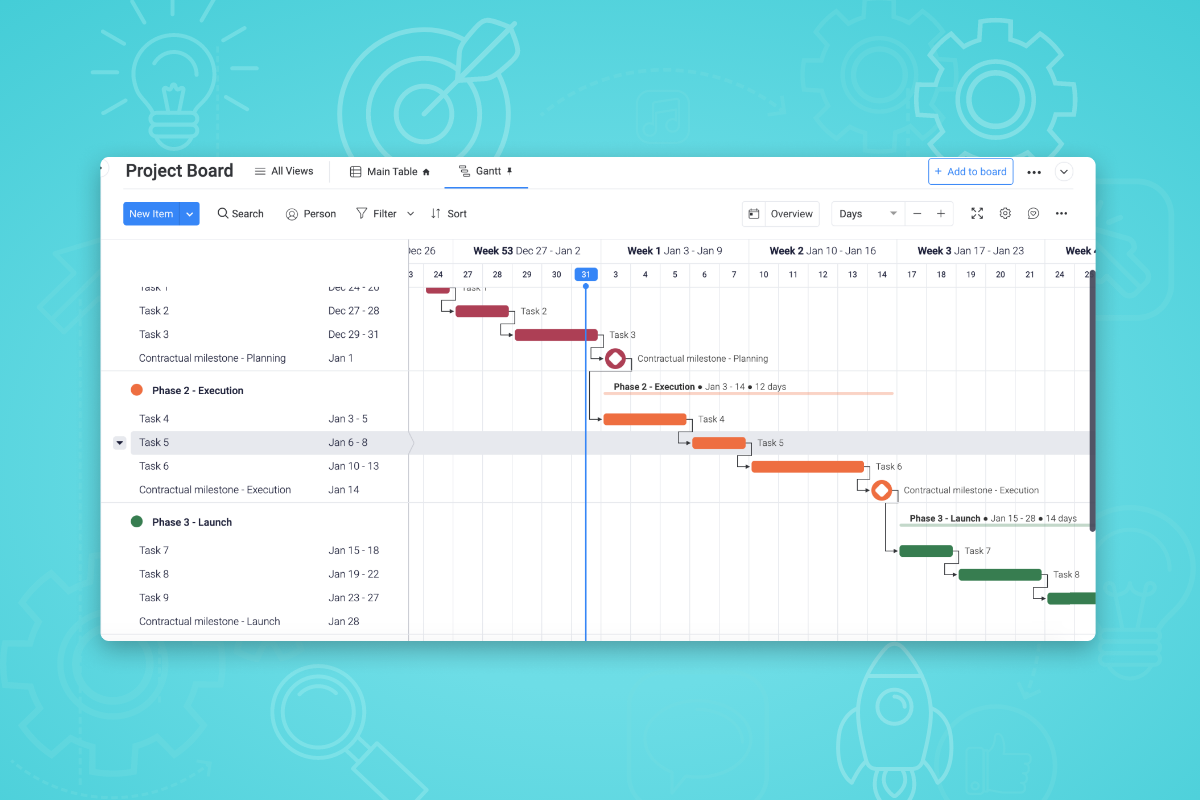
Monday.com is a project management solution that allows users to create Gantt charts and share them across their team. You can build a Gantt chart with the help of the dynamic table view, which can also be used to create timelines, Kanban boards, and a project calendar.
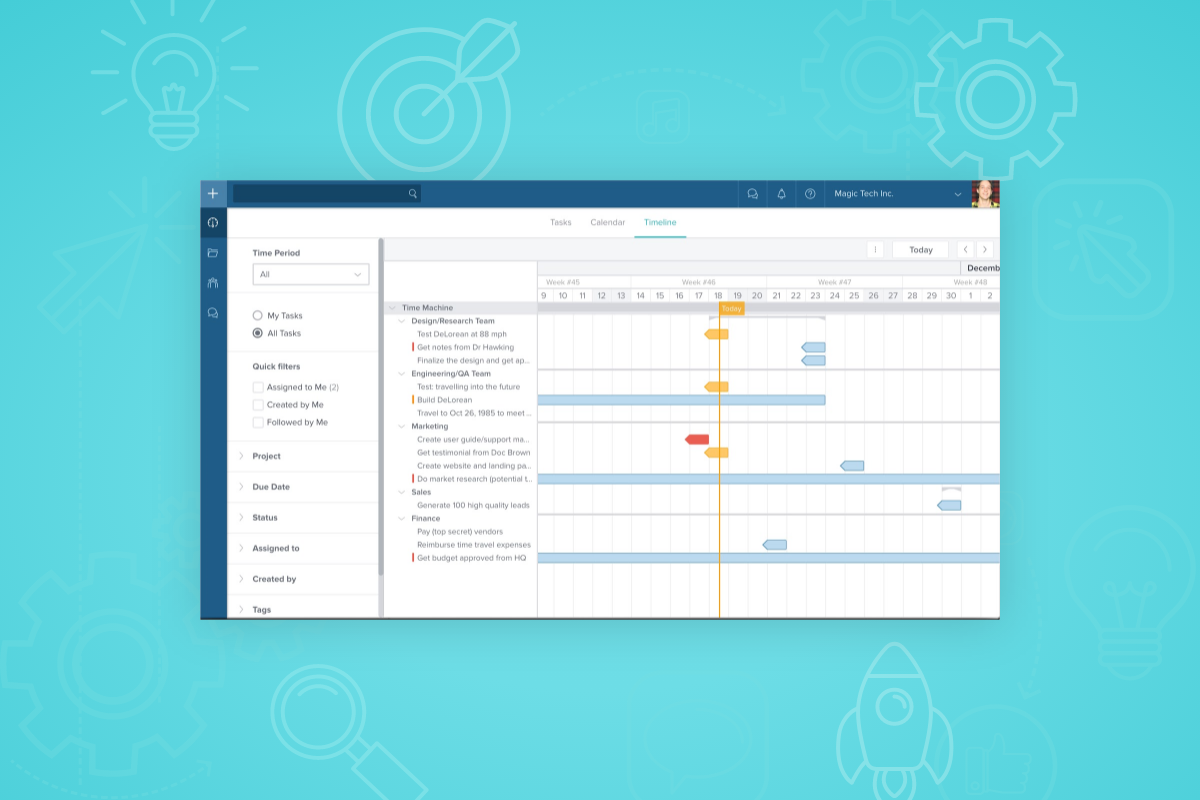
TaskWorld provides a wide range of project management tools, with Gantt charts being one of its primary features. It allows you to define each task with detailed information, organize schedules, and use drag and drop to modify your Gantt chart. It aids in better task communication with the help of in-app messaging where you can directly share your timelines and other project-related details.
Look for more features
So, this was our list of the best Gantt chart software that you should know about. Of course Gantt charts aren’t an all-in-one solution to your projects. You should find a tool that uses charts as a part of a bigger, more complex set of features that work together. If you’re looking for something similar, we’re more than happy to recommend you something that’ll suit your needs.
If you are looking for an all-in-one project management tool, Vault ERP is here to help. It offers customization and many tools to help you manage your projects. The Schedule (Gantt chart method) in Vault ERP enables users to add tasks with requirements and add info about resources, skills, risks, dependencies, time estimates, deadlines, milestones and completion in % for partially completed tasks. A zoom icon provides a full-screen view of the schedule, which can be viewed by week, month, quarter or a year. A menu of shortcuts enhances your UI experience. Learn more about Gantt charts in Vault ERP here on our blog.
Explore other project management tools in Vault ERP here.