Software development KPIs can help you get a better picture of the performance and efficiency of your development team, software quality, and can help evaluate the costs and time that are required for a project. These metrics are important for companies that want to grow.
Some of them are easy to measure while others are highly subjective. With every KPI you need to watch your business goals as well as measure profitability and customer satisfaction.
Read on: Have you properly defined your KPIs to your best advantage?
How can you benefit by tracking KPIs?
Collecting data is always a good decision as it allows you to enhance your performance and back up your decisions. Some of the main benefits of tracking KPIs in software development include:
- Increase project profitability
- Improve team productivity
- Easily set up realistic goals
- Fulfil plans and schedules
- Keep projects on budget and on time
- Have projects under control
- Deliver tasks on time
- Have more satisfied clients
- Increase business reputation
Let’s have a look at the key metrics which you can easily measure with Vault. It’s important to choose the metrics that are easy to measure and understand but are also relevant for you and your team. It’s better to carefully select a few metrics, otherwise you may be overloaded with numbers. With all those KPIs you need to improve your processes and deliver work on time without going over budget. These metrics should work for you, not against you.
By adopting an Agile approach to project management and software development, you can get valuable insight which’ll help your teams deliver work to the customer faster and improve work processes. Results are evaluated regularly so that teams can react quickly and effectively.
Key metrics to watch in the software development process
Lead time is the period between the moment a task was created and added to the task board, and the moment it was completed. The lead time, in a broader sense, can also be the period from a client’s request to the release of a requested solution.


Cycle time is part of the lead time and contains the time dedicated to the actual work on a task. It’s the lead time of the task minus the amount of time the task was sitting in the task board for.

Team velocity shows the amount of work a team has done during a single sprint. Projects are usually divided into sprints in order to make the development process more efficient and clearer for the team. Each sprint has a certain number of tasks that must be closed at the end so that you can see the number of completed tasks within a sprint. The Team velocity indicator is unable to analyze the productivity of your teams and projects because each sprint has a different scope of tasks, complexity level, etc. That’s why each team has a unique velocity, it doesn’t mean that the team with a lower velocity level is less productive than the team with a higher velocity level. Knowing the velocity will provide you with an estimate of how long it’ll take to complete the project. With Vault, you’ll clearly see how many tasks are remaining.

Open/close rates show the number of tasks that were opened/closed within a certain period of time. It’s important to remember that this metric won’t show the efficiency of your team. This is because a developer can work on one difficult task for a few days while another developer fixes ten small and easy tasks in the same time. With Vault, you can define the complexity level of each task so that you can have a better picture when it comes to evaluating the efficiency of your team members.


Sprint burndown chart represents the workflow of the project. It shows how much work has already been done and how much is left. Ideally, the chart’s straight line should steadily lower towards the mark of zero tasks or work hours.

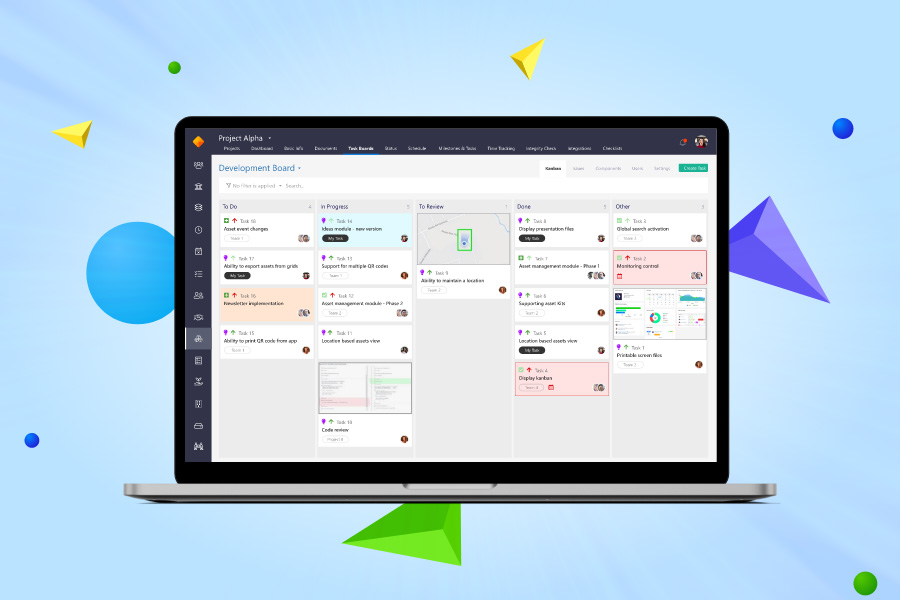
Cumulative flow chart illustrates the relationship between time and the number of tasks on the project during sprints. It’s related to the Kanban method and shows the whole bulk of work distributed according to different stages of the work process like To-do, In Progress, To Review and Done. This cumulative flow diagram indicates what percentage of tasks are in the To-do list and have been completed at certain points of time. It’s an excellent illustration of the project workflow and task distribution that reveals all the bottlenecks or redundant capacities of the team. Ideally, the capacity and workload should be balanced otherwise it may frustrate the team.

Another metric which can be measured through Vault is defects tracked by the testing team. Let’s have a look at which KPIs measure the effectiveness of the development team:
Defects fixed per day show how effectively your development team works on defects you reported in the system. This KPI will ensure that your development team is aligned with the progress timeline and is moving forward on a daily basis.

Defects fixed per developer is used to measure the effectiveness of each developer but is subjective as some bugs could be harder to fix than others. Hence why it’s crucial to define the complexity level of each task. This could be used to predict the amount of work for the development team. More complex defects will usually require a higher level of focus from developers.

Defect resolution success ratio measures the number of defects resolved and reopened. If none of the defects are reopened, then a 100% success rate is achieved in terms of resolution.

Fixed defects percentage identifies the percentage of defects fixed compared to the total number of reported defects.

Read on: Vault's Ultimate Guide: Tracking KPIs for your QA team
Customization offers you much more
As you can see, Vault allows you to track the important stats for better management of your development teams or departments. Whilst browsing specific KPI and metrics, you may find that most of them are suitable for an Agile approach. But with Vault’s customization you can easily apply this tracking to a Waterfall approach. We’re all aware that every project must be approached differently.
Read on: Going agile with Vault
There’s also a possibility that specific metrics that are important for you can’t be customized. Don’t worry, we consider this scenario the biggest value that Vault can offer you. By combining our customer service with our experienced developers, we can provide enhanced customization capabilities. Just contact us and let us know what functionality would enhance your business. We’ll take care of the rest.
.png)